
Our best customers wanted one video, not a daily habit
The users most likely to pay us looked the most likely to leave. It took a pile of charts to see why.
In October 2026 we ran ads for our teleprompter app and read every script new people pasted in. The serious users were small business owners, not would-be influencers: real-estate agents, a hair-care line, a sales recruiter, a small agency. Each brought a finished script of 100 to 500 words, often written with ChatGPT. They recorded it and left.
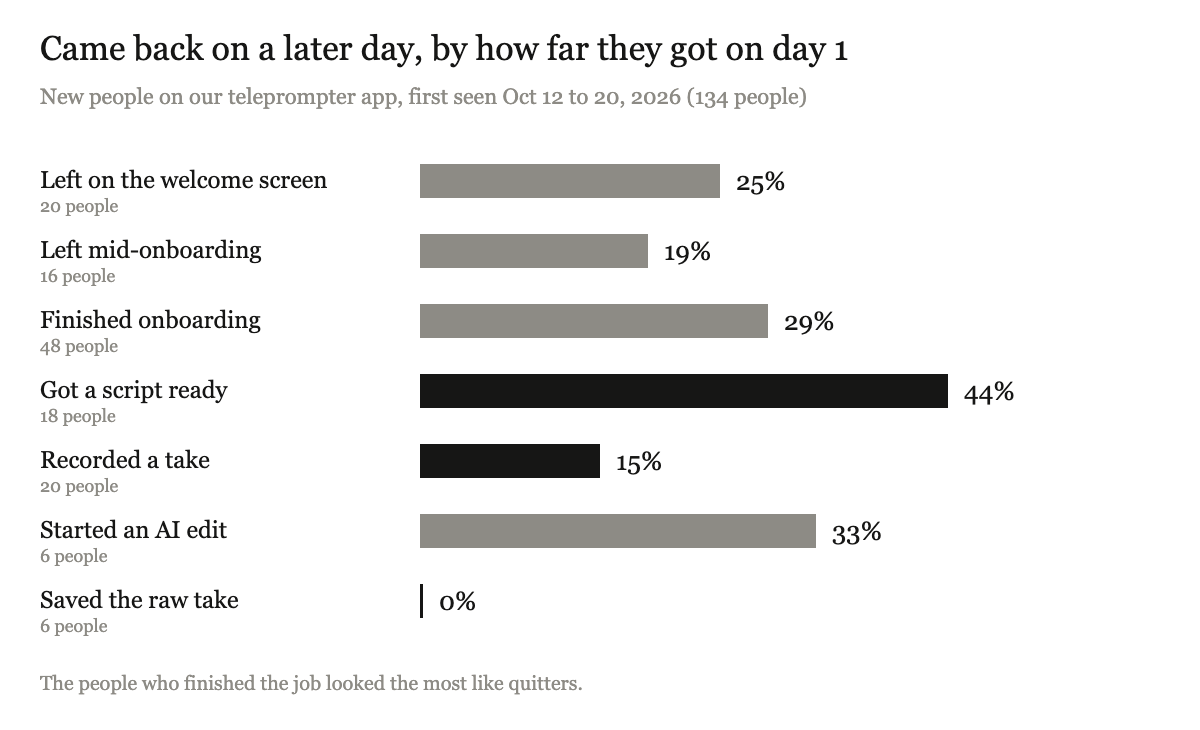
Going further on day one went with coming back less. The people who reached the real finish line never returned.
People who only got a script ready came back on a later day 44% of the time. People who recorded a take came back 15% of the time. The six who saved their raw take came back 0% of the time. It looks like finishing the job makes people quit. I almost believed it.
Why does daily retention lie for low-frequency products?
The daily view said we were leaking. From October 12 to 23, 174 new people arrived, 41 recorded a take, and only 24% came back on any later day. Of 134 people from October 12 to 20, just 10 recorded again later: 7%.
The scripts told another story. These buyers had one listing, one product drop, one open role. They needed a new video when life handed them something new to promote, which happens monthly or a few times a year.
We were grading a monthly need with a daily ruler.
That ruler came from elsewhere. Andrew Chen writes that "DAU/MAU has been a popular metric because of Facebook, which popularized the metric," and he passes on the rule of thumb that apps over 20% "are said to be good, and 50%+ is world class." That benchmark grew up in a product people opened daily.
In 2016, Archana Madhavan at Amplitude wrote that "The product usage interval is the frequency (daily, weekly, monthly, etc.) with which you expect people to naturally use your product." Sequoia's data science team says the same: "Depending on the vertical of your product, a daily, weekly or monthly time frame may be most meaningful."
Brian Balfour's 2013 test for product market fit: "IF it flattens off at some point, you have probably found product market fit for some market or audience." Put that next to Madhavan's idea and you get this.
A curve can only flatten on the clock the need runs on.
Track a monthly need day by day and almost nobody has the need on any single day, so the curve slides toward zero and you decide there is no fit. Group the same people in 30-day buckets and it may hold steady. A daily dashboard can talk you into killing a product that works.
How do you measure retention on a customer's natural rhythm?
- Name the trigger. One sentence on what makes the customer need you again. Ours: "a new listing, a new product, or a new offer to promote."
- Put a number on the rhythm. Guess how often the trigger happens, then check it against what users say or do.
- Count "within" a window, not "on day N." Someone back on day 6 is gone "on day 7" but retained "within 7 days." Pull returns within 1, 7, 30 and 90 days.
- Choose the window before you look. For a monthly rhythm, the 30-day number is your retention. Deciding first stops you picking the flattering one.
- Shrink the denominator. Where you can, count only people who had another need inside the window. Then you ask: when they needed this again, did they pick us?
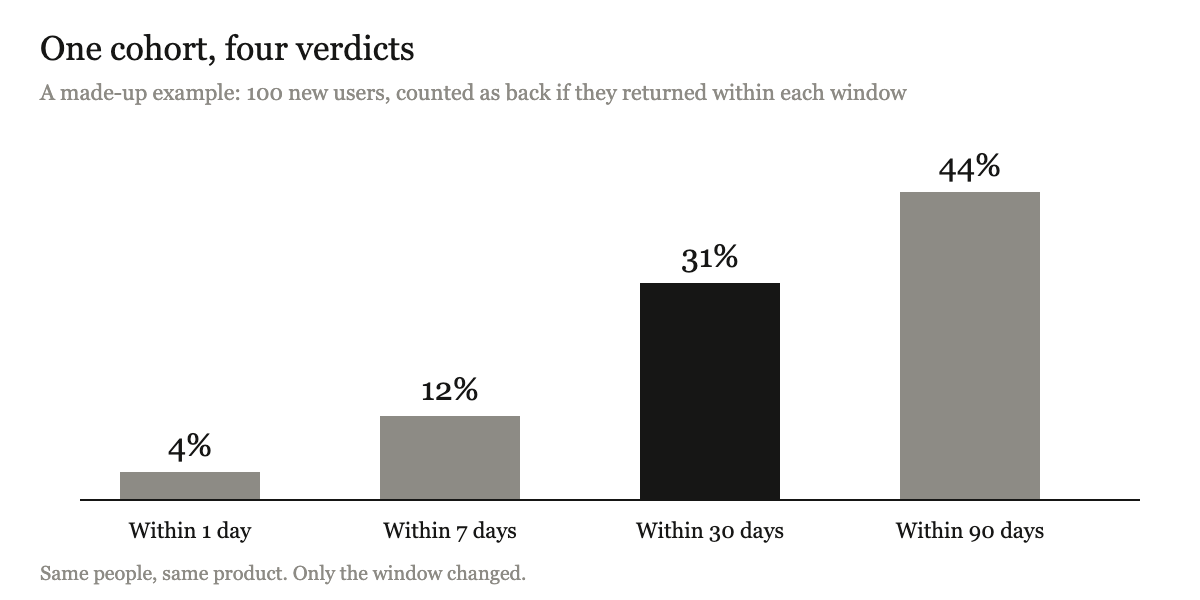
The same pretend cohort gets four verdicts. Daily, it looks dead. Monthly, almost a third stayed.
To try it, pick how often your customer naturally needs your product, then type in your cohort size and how many came back within 1, 7, 30 and 90 days.
What does the "next one" moment look like?
We had also built for the wrong clock: a trends feed, a score on every take, stage emails. Daily features do not create daily need. An agent with one listing this month needs a finished video, not fresh trends.
Nothing in our app asked about video number two. Push notifications were on for about 10 people in total. The 0% return among savers did not prove they were done with us. It proved we never asked when they would be back.
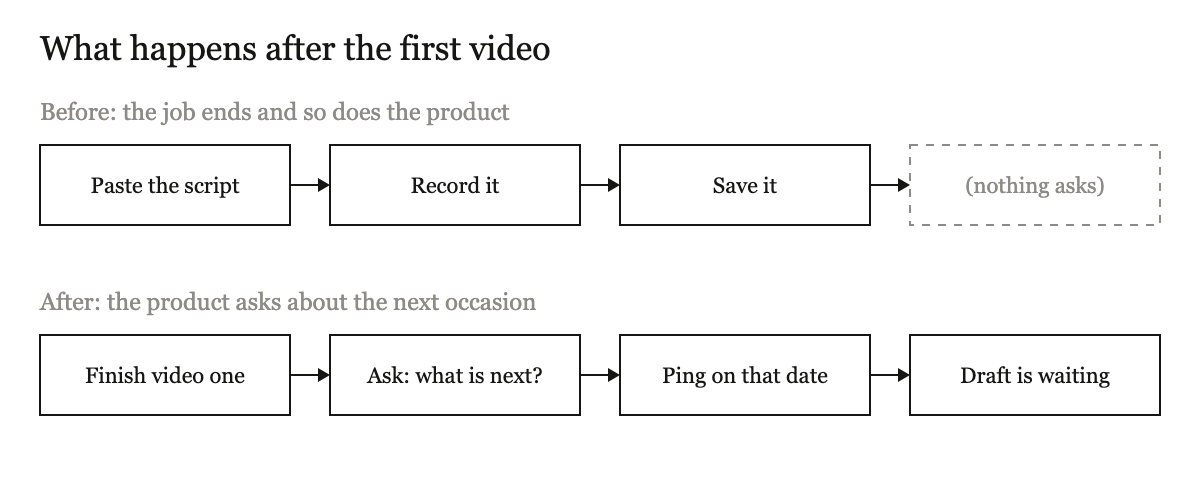
On the left the product stops when the job stops. On the right, finishing one video sets up the next.
The fix is one question at the end of the first job: what will you promote next, and when? Then show up that day with a draft ready. The window you measure is the moment you design for.
This buyer is exactly who Earshot for brands is for. It makes done-for-you creator videos for businesses that need a promo. I build it, so weigh that.
Two made-up cases show the rule cuts both ways. A founder with a video tool for agents judges a 30-day window keyed to "finished a listing video" and asks when the next listing goes live. A meditation-app founder wants a monthly window because it looks nicer, but his need really is daily, so his 1-day and 7-day numbers stay the truth.
Our best customers did want us: one video, then another weeks later. Measure the weeks. Build the moment they return.
Read the full article on Medium
Sources
- Andrew Chen: DAU/MAU is an important metric to measure engagement, but here's where it fails
- Brian Balfour: The Never Ending Road To Product Market Fit (December 11, 2013)
- Archana Madhavan, Amplitude: How often should people use your app? (October 11, 2016)
- Sequoia Capital Data Science Team: Retention